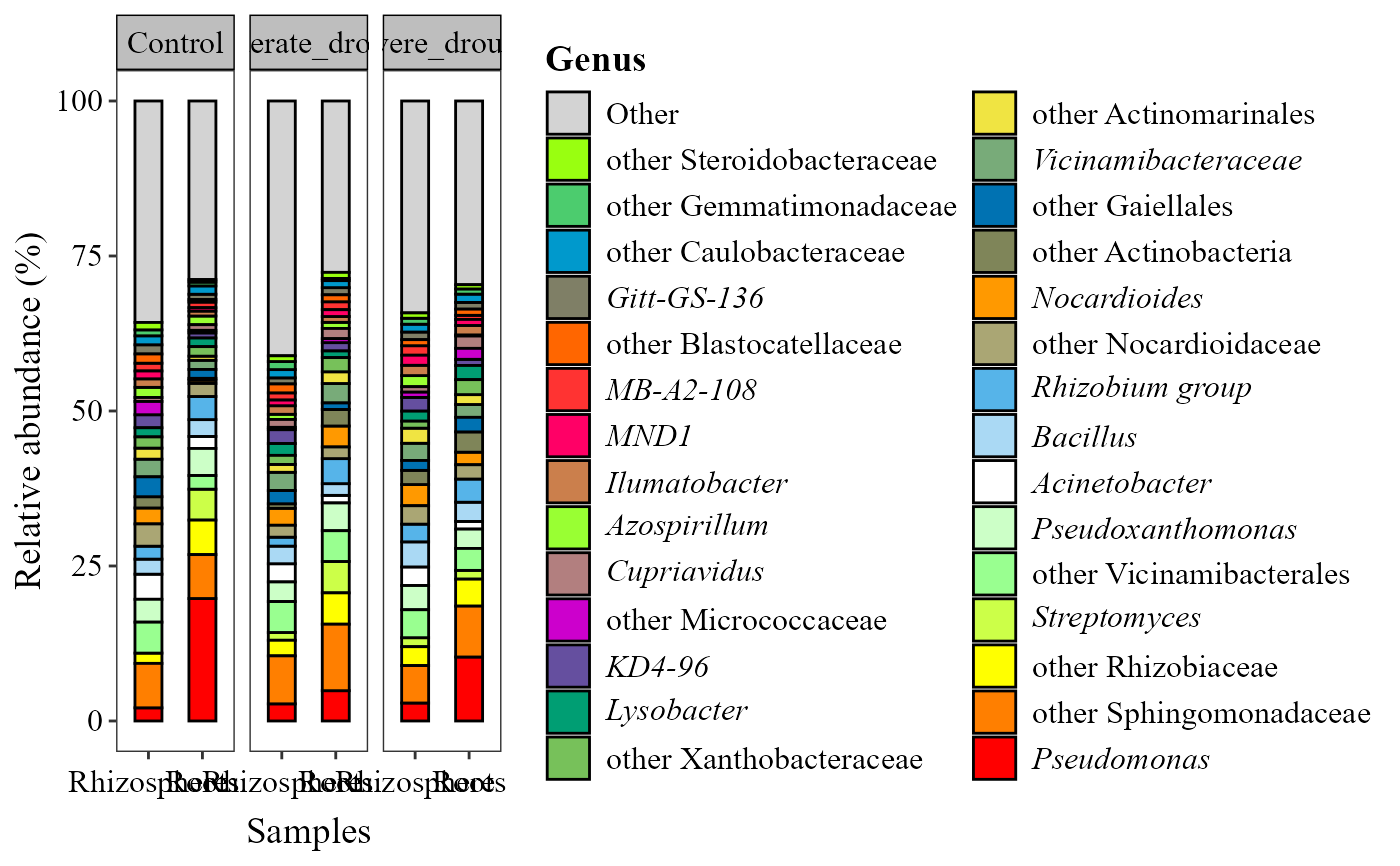
Generates a bar plot of relative abundance (%) for the most abundant taxa groups across samples or sample groups.
Usage
abundance_bar_plot(
  table,
  metadata = NULL,
  taxonomy_db = "silva",
  level = "genus",
  x_col = NULL,
  facet_by = NULL,
  width_equal = FALSE,
  label = "taxonomy",
  top_n = 15,
  x_axis_title = "Samples",
  y_axis_title = "Relative abundance (%)",
  x_label_angle = 0,
  strip_text_bold = FALSE,
  strip_color = "grey",
  palette = "default",
  taxa_colors = NULL,
  taxa_order = "ascending",
  aspect_ratio = NULL,
  add_remained = FALSE,
  save_table = FALSE,
  table_filename = "relative_abundance.txt"
)
Arguments
- table
A data frame with taxa in rows and samples in columns. The last column must be named
taxonomy, containing full taxonomic strings.- metadata
A data frame containing sample metadata. Its first column must hold the sample IDs (the column names of
table). Optional: ifNULL(default), one bar is drawn per sample.- taxonomy_db
Character. Database the taxonomy strings come from:
"silva"(default),"gg2"(Greengenes2, also"gg"),"unite"or"Kraken2"(also"kraken"). Case-insensitive.- level
Character. Taxonomic level:
"kingdom","phylum","class","order","family","genus"(default) or"species". Case-insensitive.- x_col
Character. Name of the column in
metadatafor the x-axis. IfNULL(default), one bar per sample.- facet_by
Character. Name of the column in
metadatato facet the plot by. Optional;NULL(default) for no facets.- width_equal
Logical. If
TRUE, all bars have equal width regardless of sample count per group. DefaultFALSE.- label
Character. Title of the taxa legend. Default
"taxonomy".- top_n
Integer. Number of most abundant taxa to show. Default
15.- x_axis_title
Character. Title of the x-axis. Default
"Samples".- y_axis_title
Character. Title of the y-axis. Default
"Relative abundance (%)".- x_label_angle
Numeric. Rotation (degrees) of the x-axis labels. Default
0(horizontal); use45or90if they overlap.- strip_text_bold
Logical. If
TRUE, the facet strip labels are bold. DefaultFALSE.- strip_color
Character. Background color of the facet strips (used when
facet_byis set). Default"grey".- palette
Character. Palette for the taxa:
"default"(bright colors, the original MicroBioMeta palette),"brewer"(the qualitative RColorBrewer palettes Accent, Dark2, Paired, Pastel1, Pastel2, Set1, Set2 and Set3 joined, without greys; not colorblind-friendly) or"safe"(colorblind-friendly "Safe" palette, 11 colors; with more taxa the colors are interpolated and are no longer fully colorblind-safe). The most abundant taxon gets the first color. Default"default".- taxa_colors
Optional named character vector of colors, one per taxon (names = taxa as shown in the legend). Taxa not named keep the
palettecolors. DefaultNULL.- taxa_order
Character. Order of the taxa in the bars and the legend:
"ascending"(default; the most abundant taxon at the bottom of both) or"descending"(the most abundant taxon at the top of both).- aspect_ratio
Numeric. Aspect ratio (height/width) of each panel. Default
NULL(automatic).- add_remained
Logical. If
TRUE, adds an "Other" category with the sum of the remaining taxa. DefaultFALSE.- save_table
Logical. If
TRUE, saves the relative-abundance table as a tab-delimited file. DefaultFALSE.- table_filename
Character. Name or path of the saved file (used when
save_table = TRUE). Default"relative_abundance.txt".
Details
Relative abundances are calculated per sample (%).
Taxa are collapsed to the taxonomic
level; taxa not resolved to that level are shown as "other". Only the top
top_ntaxa are shown; others are filtered out.Samples are grouped and ordered according to
x_col.Optional faceting by
facet_byif provided.Features assigned only to a kingdom/domain (e.g.
"d__Bacteria;__;__;__;__;__") or"Unassigned"are removed.
Examples
table_path <- system.file("extdata", "subset_table_bacteria.txt", package = "MicroBioMeta")
table <- read.delim(table_path, row.names = 1, check.names = FALSE)

metadata_path <- system.file("extdata", "subset_metadata_bacteria.txt", package = "MicroBioMeta")
metadata <- read.delim(metadata_path, check.names = FALSE)

abundance_bar_plot(
    table = table,
    metadata = metadata,
    taxonomy_db = "silva",
    level = "genus",
    x_col = "Location",
    label = "Genus",
    facet_by = "Treatment",
    top_n = 30,
    add_remained = TRUE
)
#> Phylum names were updated to their validly published names (Oren & Garrity 2021, used by NCBI Taxonomy): Actinobacteriota -> Actinomycetota, Chloroflexi -> Chloroflexota, Cyanobacteria -> Cyanobacteriota, Firmicutes -> Bacillota, Proteobacteria -> Pseudomonadota (shown once per session).