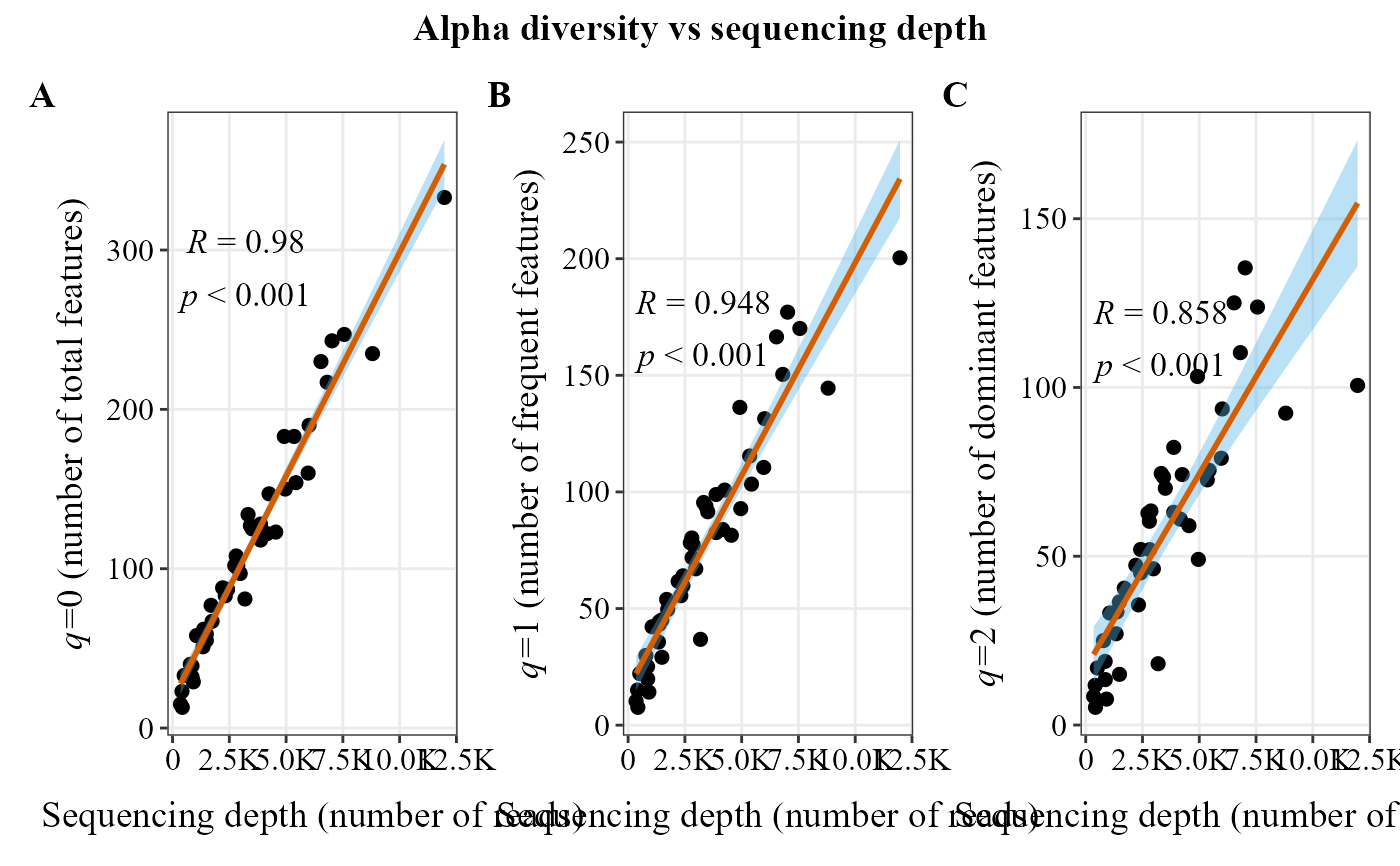
Computes the Hill numbers (q = 0, 1, 2) of each sample and plots each against the sequencing depth (total reads), with a regression line and the correlation coefficient, combining the three panels in one figure.
Usage
alpha_hill_corr_plot(
  table,
  method = "spearman",
  facet_orientation = "horizontal",
  title = "auto",
  panel_label_case = "upper",
  panel_labels = NULL,
  panel_label_bold = TRUE,
  save_table = FALSE,
  table_filename = "hill.txt",
  x_axis_title = "Sequencing depth (number of reads)"
)
Arguments
- table
A data frame with taxa in rows and samples in columns. The last column must be named
taxonomy, containing full taxonomic strings.- method
Character. Correlation method passed to
ggpubr::stat_cor. One of"spearman"(default, rank-based and robust to non-linear/non-normal relationships),"pearson", or"kendall".- facet_orientation
Character.
"horizontal"(default) puts the three q0/q1/q2 panels in a row;"vertical"in a column.- title
Character. Plot title.
"auto"(default) shows"Alpha diversity vs sequencing depth";NULLshows no title; any other text is used as the title.- panel_label_case
Character. Case of the panel tags:
"upper"(default; A, B, C) or"lower"(a, b, c). Ignored ifpanel_labelsis given.- panel_labels
Optional character vector of custom panel tags, one per panel (q0, q1, q2), used as-is (e.g.
c("(a)", "(b)", "(c)")). Overridespanel_label_case.- panel_label_bold
Logical. If
TRUE(default), panel tags are bold. Set toFALSEfor journals that require plain (non-bold) panel tags.- save_table
Logical. If
TRUE, saves the Hill numbers table as a tab-delimited file. DefaultFALSE.- table_filename
Character. Name or path of the saved file (used when
save_table = TRUE). Default"hill.txt".- x_axis_title
Character. Title of the x-axis of the three panels. Default
"Sequencing depth (number of reads)".
Examples
table_path <- system.file("extdata", "subset_table_bacteria.txt", package = "MicroBioMeta")
table <- read.delim(table_path, row.names = 1, check.names = FALSE)
# Always tagged A/B/C (see panel_label_case and panel_labels to customize)
alpha_hill_corr_plot(
table = table,
facet_orientation = "horizontal"
)
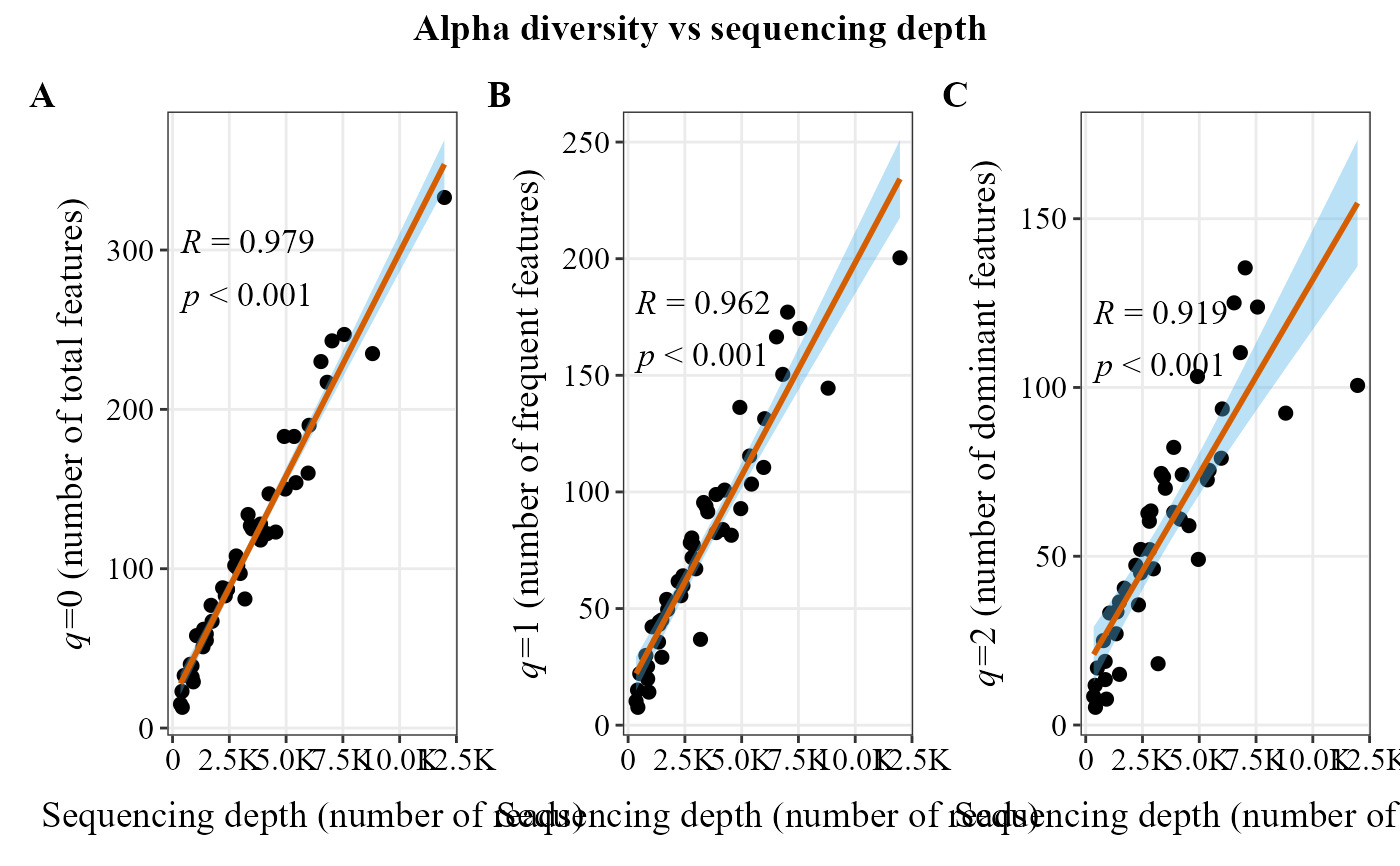 ## Using Pearson correlation instead of the default Spearman
alpha_hill_corr_plot(
table = table,
method = "pearson"
)