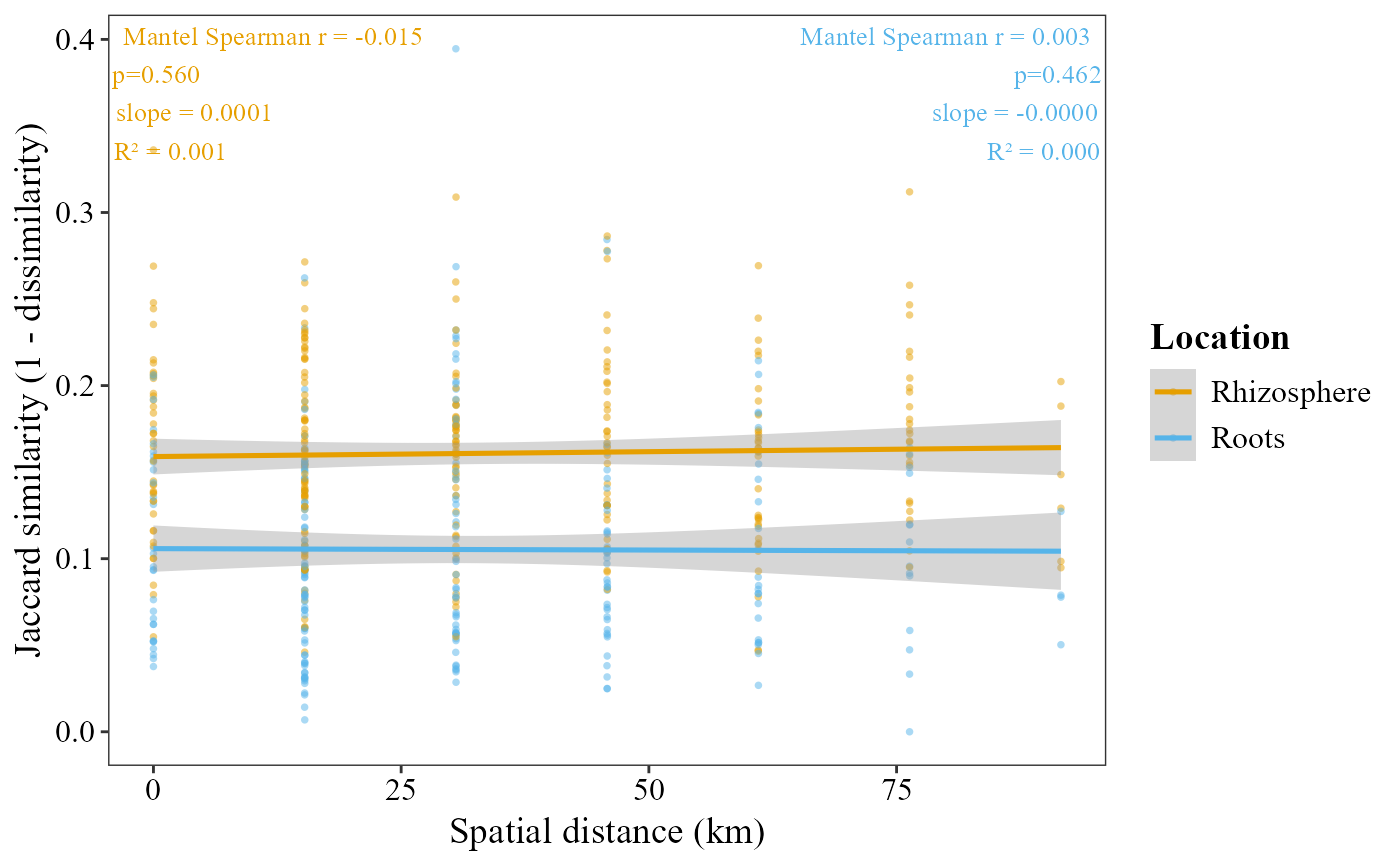
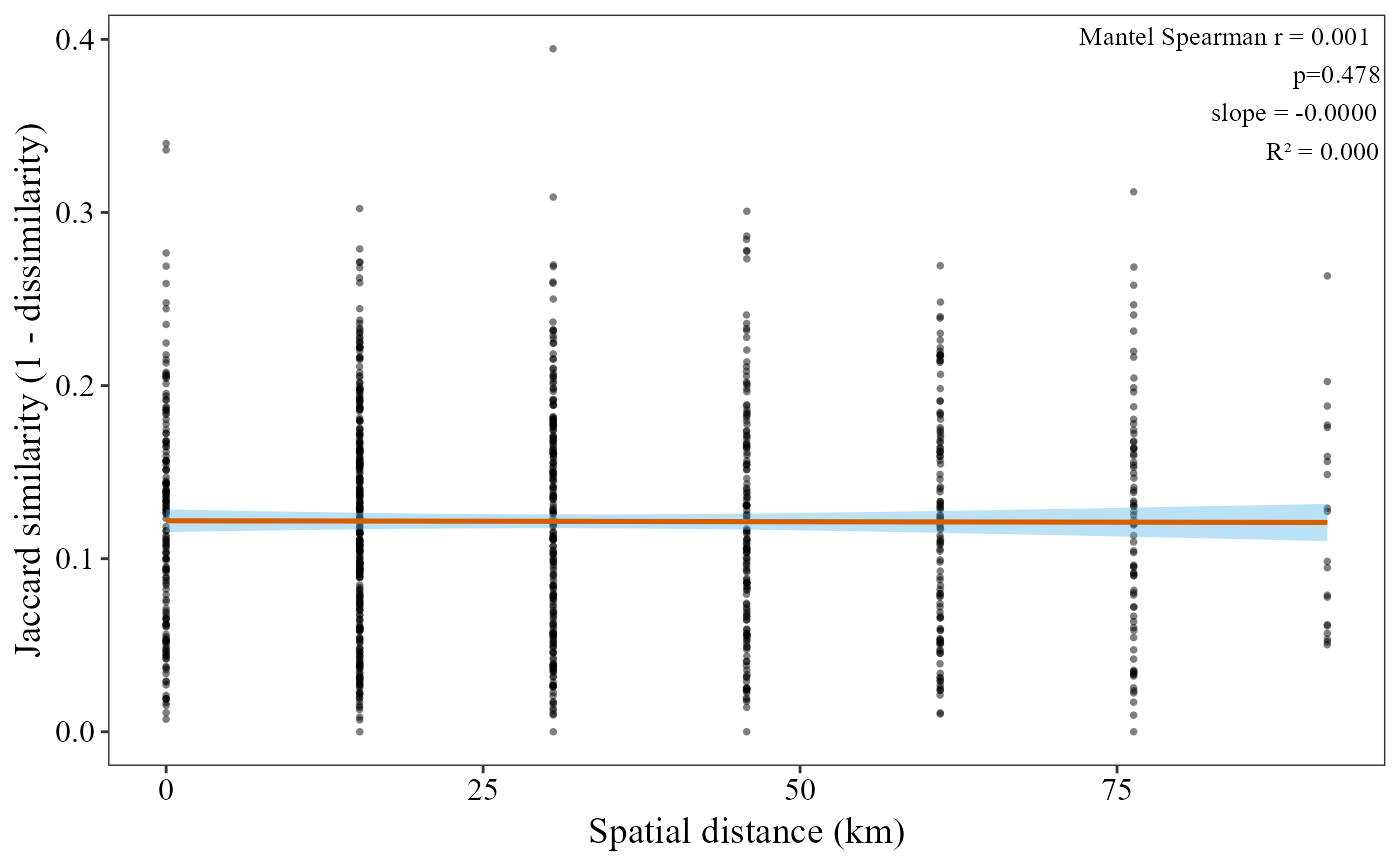
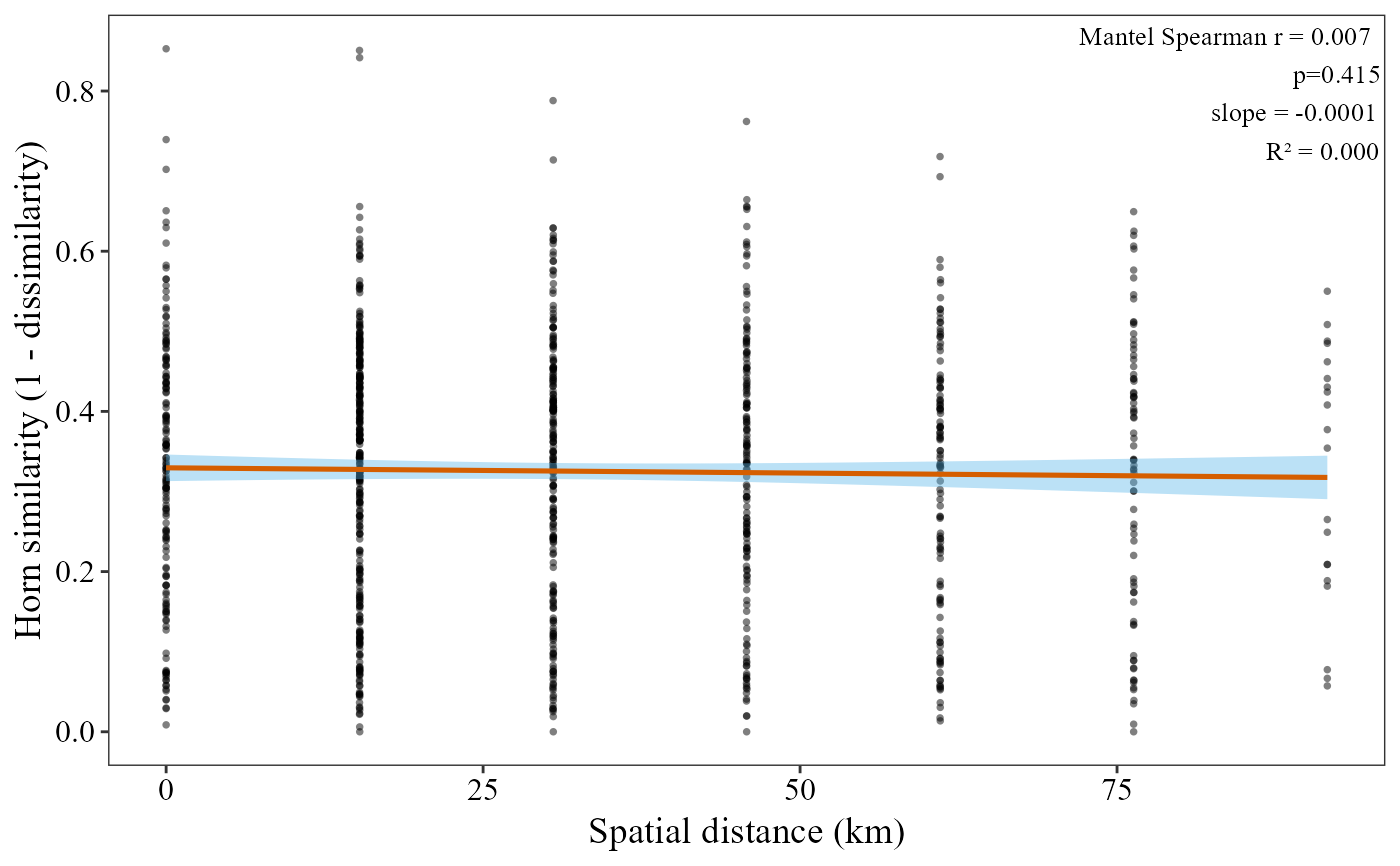
Computes the pairwise community dissimilarity (Jaccard, Morisita-Horn, Bray-Curtis or another vegdist method) and the pairwise geographic distance from the sample coordinates in metadata, and tests their relationship with a Mantel test.
Usage
beta_decay_plot(
  table,
  metadata,
  lat_col,
  lon_col,
  group_col = NULL,
  palette = "colorb",
  distance = "jaccard",
  method = "spearman",
  permutations = 999,
  show_lm_stats = TRUE,
  point_color = "black",
  line_color = "#D55E00",
  point_size = 1,
  point_alpha = 0.5,
  annotation_size = 3.5,
  x_axis_title = "Spatial distance (km)",
  y_axis_title = NULL,
  title = NULL
)
Arguments
- table
A data frame with taxa in rows and samples in columns. The last column must be named
taxonomy, containing full taxonomic strings.- metadata
A data frame containing sample metadata. Its first column must hold the sample IDs (the column names of
table). It must also have the latitude and longitude columns.- lat_col
Character. Name of the latitude column in
metadata(decimal degrees).- lon_col
Character. Name of the longitude column in
metadata(decimal degrees).- group_col
Character. Name of the column in
metadatathat defines the groups. If given, only pairs of samples from the same group are kept, with one color per group. Optional;NULL(default) for no groups.- palette
Palette name (
"colorb"(default),"safe","earth","grey","viridis"or"brewer") or a vector of colors, one per group. Only used whengroup_colis given.- distance
Character. Dissimilarity metric passed to
vegan::vegdist. Common options:"jaccard"(default),"horn"(Morisita-Horn / Hill q = 1 analogue),"bray"(Bray-Curtis). Any method accepted byvegdistis valid. Case-insensitive.- method
Character. Correlation method for the Mantel test:
"spearman"(default) or"pearson". Case-insensitive.- permutations
Integer. Number of permutations for the Mantel test. Default
999.- show_lm_stats
Logical. If
TRUE(default), adds \(R^2\) to the annotation label in addition to the Mantel r, p-value, and slope.- point_color
Character. Color of scatter points. Default
"black".- line_color
Character. Color of the regression line. Default
"#D55E00".- point_size
Numeric. Size of the points. Default
1.- point_alpha
Numeric (0-1). Transparency of the points. Default
0.5.- annotation_size
Numeric. Font size for the stats annotation. Default
3.5.- x_axis_title
Character. Title of the x-axis. Default
"Spatial distance (km)".- y_axis_title
Character. Title of the y-axis. If
NULL(default), it is built automatically.- title
Character. Plot title.
NULL(default) shows no title.
Examples
table_path <- system.file("extdata", "subset_table_bacteria.txt", package = "MicroBioMeta")
table <- read.delim(table_path, row.names = 1, check.names = FALSE)
metadata_path <- system.file("extdata", "subset_metadata_bacteria.txt", package = "MicroBioMeta")
metadata <- read.delim(metadata_path, check.names = FALSE)
loc_coords <- data.frame(
Loc = 1:7,
lat = 19.0 + seq(0, 0.6, length.out = 7),
lon = -99.0 + seq(0, 0.6, length.out = 7)
)
metadata$lat <- loc_coords$lat[match(metadata$Loc, loc_coords$Loc)]
metadata$lon <- loc_coords$lon[match(metadata$Loc, loc_coords$Loc)]
# Jaccard + Spearman Mantel (default)
beta_decay_plot(
table = table,
metadata = metadata,
lat_col = "lat",
lon_col = "lon"
)
 # Horn dissimilarity + Spearman Mantel
beta_decay_plot(
table = table,
metadata = metadata,
lat_col = "lat",
lon_col = "lon",
distance = "horn",
method = "spearman"
)
 # Separate Mantel test per location
beta_decay_plot(
table = table,
metadata = metadata,
lat_col = "lat",
lon_col = "lon",
group_col = "Location"
)