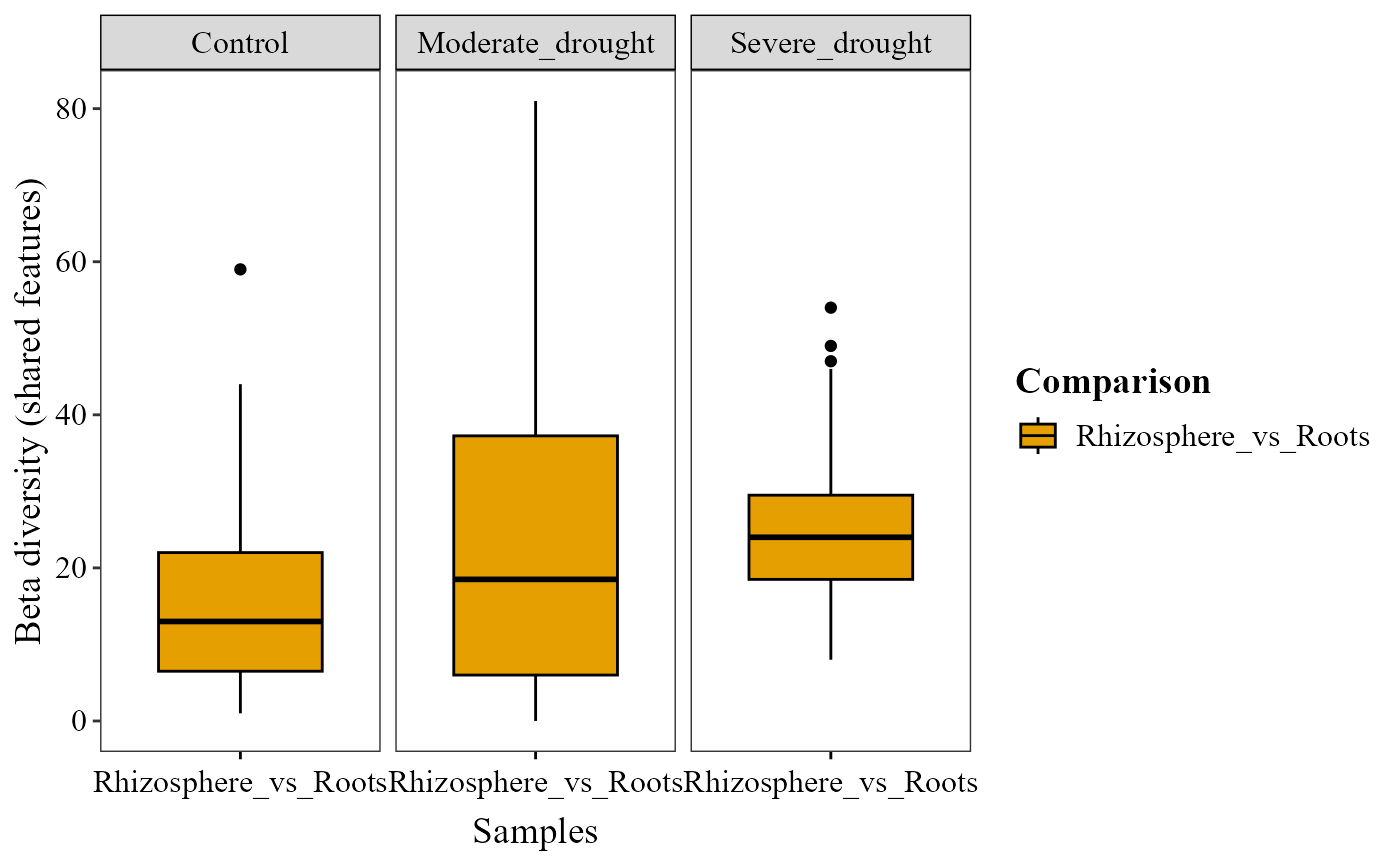
Computes the pairwise beta diversity between samples (shared features, turnover or nestedness) and plots it as box plots, one box per pair of groups.
Usage
beta_dissimilarity_plot(
  table,
  metadata,
  comparison_condition1 = NULL,
  condition1_col,
  condition2_col = NULL,
  facet_colors = NULL,
  group_colors = NULL,
  x_axis_title = "Condition",
  y_axis_title = NULL,
  partition = c("shared", "turnover", "nestedness"),
  family = c("sorensen", "jaccard"),
  stat = NULL,
  p_adjust_method = "holm",
  show_x_labels = TRUE,
  x_label_angle = 0,
  strip_text_bold = FALSE,
  strip_text_color = "black",
  aspect_ratio = NULL,
  save_table = FALSE,
  table_filename = "betadiv_table.txt"
)
Arguments
- table
A data frame with taxa in rows and samples in columns. The last column must be named
taxonomy, containing full taxonomic strings.- metadata
A data frame containing sample metadata. Its first column must hold the sample IDs (the column names of
table).- comparison_condition1
Optional character vector with the pairs of groups of
condition1_colto show (e.g."Rhizosphere_vs_Roots"; the order of the two groups does not matter). IfNULL(default), all pairs are shown.- condition1_col
Character. Name of the column in
metadatawhose groups are compared: each box is one pair of groups.- condition2_col
Character. Name of a second column in
metadata. If given, only pairs of samples with the same value are kept, and the plot is faceted by it. Optional;NULL(default) for none.- facet_colors
Optional character vector of background colors for the facet strips. If
NULL(default), a neutral"grey85"is used.- group_colors
Optional character vector of colors, one per comparison on the x-axis, named after them or in their order. If
NULL(default), the colorblind-friendly Okabe-Ito palette is used.- x_axis_title
Character. Title of the x-axis. Default
"Condition".- y_axis_title
Character. Title of the y-axis. If
NULL(default), it is built automatically.- partition
Type of beta diversity to compute:
"shared"(default),"turnover", or"nestedness". Case-insensitive.- family
Dissimilarity family for the turnover/nestedness partition:
"sorensen"(default) or"jaccard". Case-insensitive.- stat
Character or
NULL. Statistical test to compare the boxes within each panel."wilcox.test"or"t.test"compare every pair of boxes, each with its own bracket and p-value (ggpubr::stat_pwc());"kruskal.test"or"anova"give one global p-value per panel (ggpubr::stat_compare_means()). DefaultNULL(no test shown).- p_adjust_method
Character. Multiple-testing correction for the pairwise tests (
stat = "wilcox.test"or"t.test"), applied within each panel, any method ofstats::p.adjust(). Default"holm";"none"uses the raw p-values.- show_x_labels
Logical. If
TRUE(default), the x-axis labels are shown.- x_label_angle
Numeric. Rotation (degrees) of the x-axis labels (when
show_x_labels = TRUE). Default0(horizontal); use45or90if they overlap.- strip_text_bold
Logical. If
TRUE, the facet strip labels are bold. DefaultFALSE.- strip_text_color
Color of the facet strip labels, which sit on the
facet_colorsbackgrounds. Default"black"(the defaultfacet_colorsis a light"grey85"; pass"white"if you supply darkerfacet_colors).- aspect_ratio
Numeric. Aspect ratio (height/width) of each panel. Default
NULL(automatic).- save_table
Logical. If
TRUE, saves the beta diversity table as a tab-delimited file. DefaultFALSE.- table_filename
Character. Name or path of the saved file (used when
save_table = TRUE). Default"betadiv_table.txt".
Examples
table_path <- system.file("extdata", "subset_table_bacteria.txt", package = "MicroBioMeta")
table <- read.delim(table_path, row.names = 1, check.names = FALSE)

metadata_path <- system.file("extdata", "subset_metadata_bacteria.txt", package = "MicroBioMeta")
metadata <- read.delim(metadata_path, check.names = FALSE)

beta_dissimilarity_plot(
    table = table,
    metadata = metadata,
    comparison_condition1 = c("Rhizosphere_vs_Roots"),
    condition1_col = "Location",
    condition2_col = "Treatment",
    x_axis_title = "Samples",
    partition = "shared",
    family = "sorensen"
)