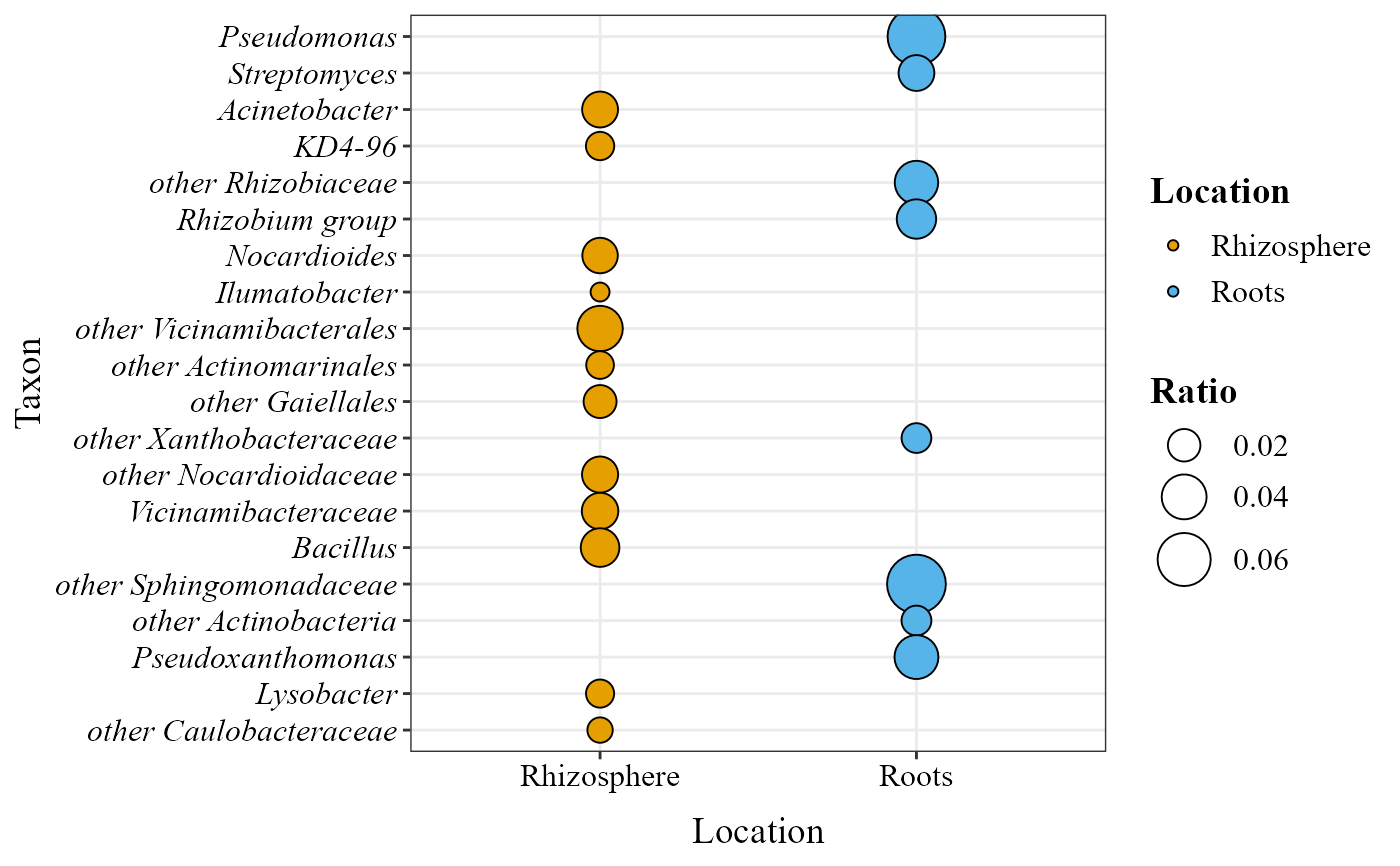
Compare taxon abundance ratios between two conditions
Source:R/ratios_bubble_plot.R
ratios_bubble_plot.RdComputes relative abundances from a taxonomic abundance table and compares two experimental conditions by calculating a directional abundance ratio for each taxon.
Usage
ratios_bubble_plot(
  table,
  metadata,
  group_col,
  condition_A,
  condition_B,
  taxonomy_db = "silva",
  top_n = 30,
  level = "genus",
  x_axis_title = "Taxon",
  legend_title = NULL,
  group_colors = NULL,
  save_table = FALSE,
  table_filename = "ratios_bubble_table.txt"
)
Arguments
- table
A data frame with taxa in rows and samples in columns. The last column must be named
taxonomy, containing full taxonomic strings.- metadata
A data frame containing sample metadata. Its first column must hold the sample IDs (the column names of
table).- group_col
Character. Name of the column in
metadatathat defines the groups.condition_Aandcondition_Bare two of its values.- condition_A
Character. Name of the first condition to compare.
- condition_B
Character. Name of the second condition to compare.
- taxonomy_db
Character. Database the taxonomy strings come from:
"silva"(default),"gg2"(Greengenes2, also"gg"),"unite"or"Kraken2"(also"kraken"). Case-insensitive.- top_n
Integer. Number of taxa with the highest mean abundance to show. Default
30.- level
Character. Taxonomic level:
"kingdom","phylum","class","order","family","genus"(default) or"species". Case-insensitive.- x_axis_title
Character. Title of the x-axis (taxon names). Default
"Taxon".- legend_title
Character. Title of the legend and of the axis showing the dominant condition. If
NULL(default), the name ofgroup_colis used.- group_colors
Optional character vector of two colors, one per condition. If
NULL(default), the package's orange/blue pair is used.- save_table
Logical. If
TRUE, saves the ratio table as a tab-delimited file. DefaultFALSE.- table_filename
Character. Name or path of the saved file (used when
save_table = TRUE). Default"ratios_bubble_table.txt".
Examples
table_path <- system.file("extdata", "subset_table_bacteria.txt", package = "MicroBioMeta")
table <- read.delim(table_path, row.names = 1, check.names = FALSE)

metadata_path <- system.file("extdata", "subset_metadata_bacteria.txt", package = "MicroBioMeta")
metadata <- read.delim(metadata_path, check.names = FALSE)

ratios_bubble_plot(
    table = table,
    metadata = metadata,
    group_col = "Location",
    condition_A = "Rhizosphere",
    condition_B = "Roots",
    taxonomy_db = "silva",
    level = "genus",
    top_n = 20
)